Project 02 · Finance · Automation
Strategy Terminal
Signal and backtest system
A backtest on 30 million one-minute candles, with real fees and a comparison against random entries. And an app that watches the markets around the clock, runs virtual trades and sends Telegram alerts.
- data30,081,926 one-minute candles · 6 markets · since 2003
- candles1m → 5m · 15m · 30m · 1h · 4h · 1D
- signalsthe same logic as in TradingView, checked candle by candle
- tradefee and spread · stop · target · maximum time
- control5 random entries against every signal
- live18 assets · every 30 min · Telegram
- 30Mone-minute candles: crypto, indices, gold, silver
- 7timeframes, from 1 minute to 1 day
- 5random entries against every signal
- 18assets live 24/7, and more can be added
The problem
An indicator shows signals but does not tell you whether they work
In TradingView it is easy to build an indicator that looks good on the chart. I wanted to know whether it really works: across years of history, with real fees and against chance.
And then to follow it live without sitting in front of the screen, with every trade recorded honestly, including the ones where I stepped in.
Part 1 · Backtest
The full one-minute history
Crypto from Binance, indices and metals from Dukascopy. Seven timeframes are built from every minute, so the test sees exactly what the chart shows.
How far back the data goes
One-minute candles by market, up to 28 September 2026. Point at a bar for details.
The rules of the test
Four ways not to fool myself
- 01
The same logic as in TradingView
The Python signals are a copy of the Pine Script indicator. A separate check compares them candle by candle, so the test measures exactly what I see on the chart.
- 02
Real costs
Every trade is counted after fees and spread, with a clear rule for the stop, the target and the maximum time in the trade.
- 03
Against chance
Every signal is compared with 5 random entries in the same direction and with the same stop. If the signal does not beat chance, there is no edge, however good it looks.
- 04
A whole portfolio
A test on 106 US stocks and 44 assets from all markets, plus Binance data on funding, open interest and aggressive orders.
Finding
Fees eat short trades
Profit factor (gains to losses) after fees in the first version of the test. Below 1, the trades lose money.
Try it yourself
How much does the fee eat?
The fee is almost the same for every trade. A short trade earns little, though, so the fee takes a bigger share of it.
An example with your own numbers. These are not results of my strategy.
Part 2 · Live
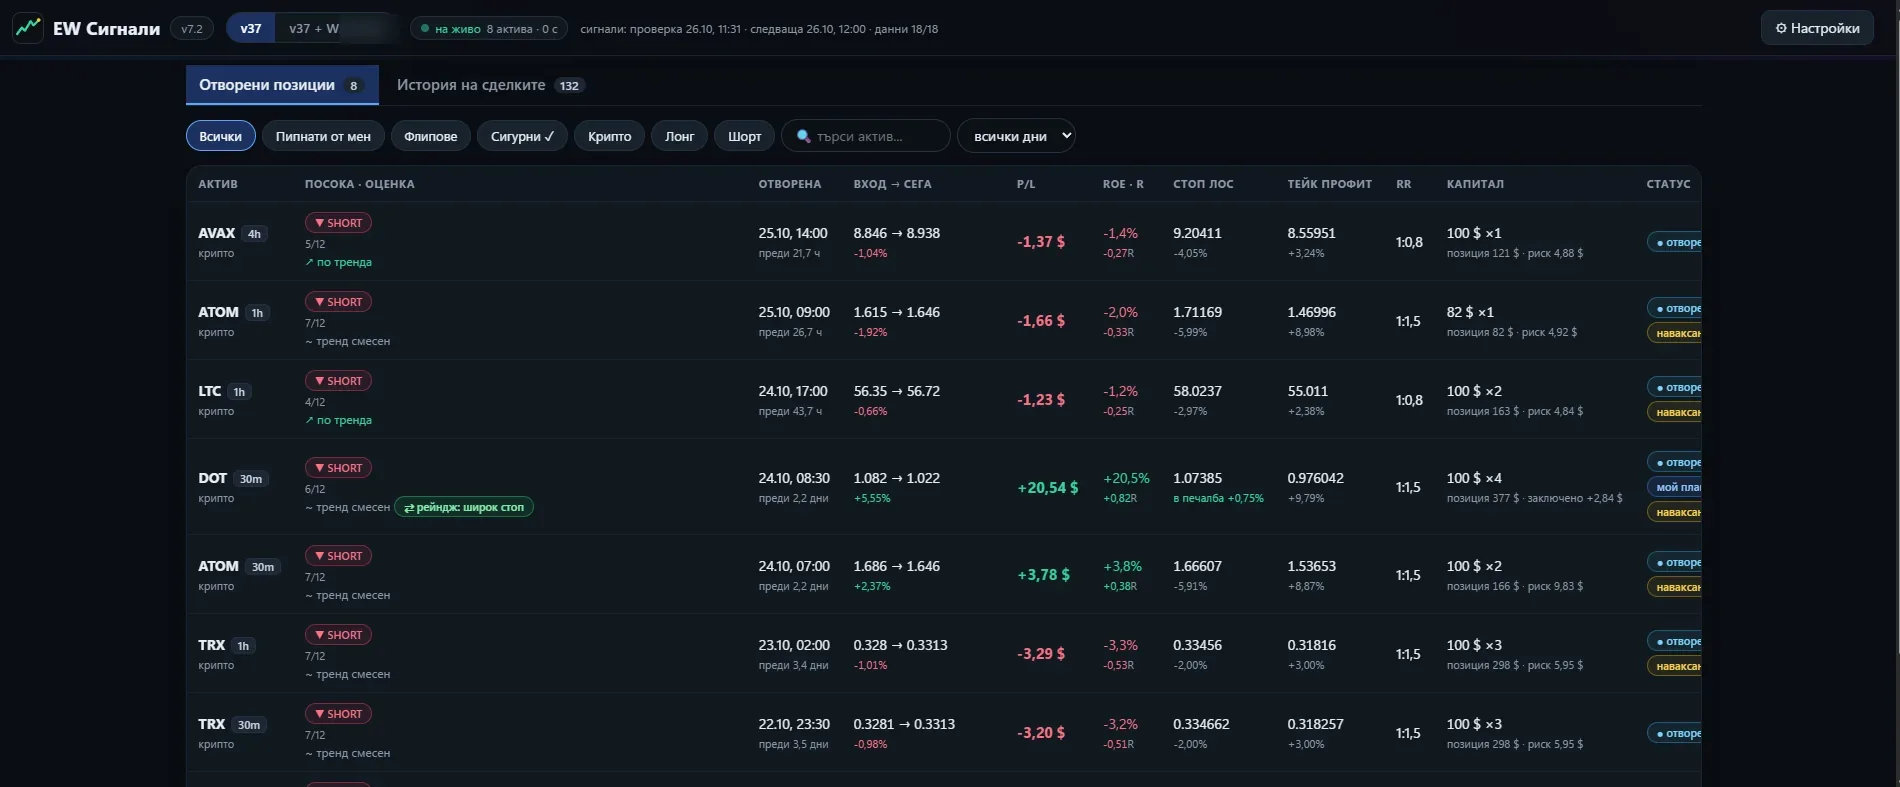
An app that works without me
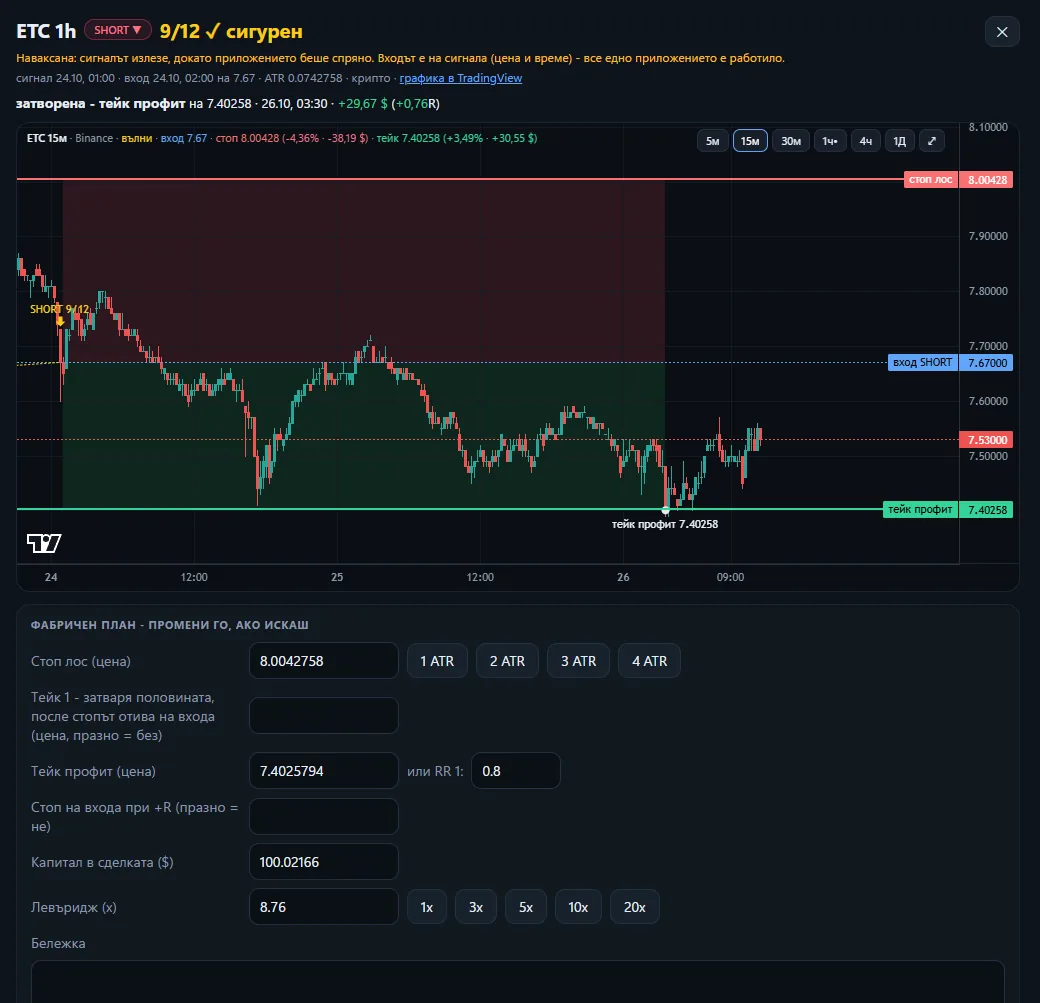
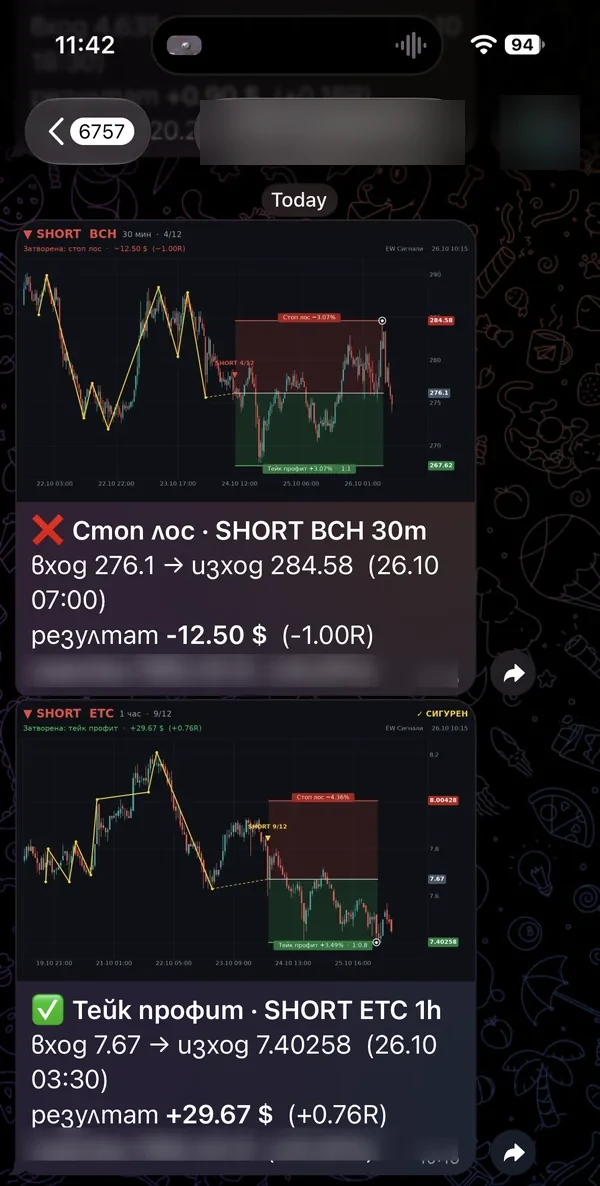
Everything is virtual, with no real orders, and fees are included. Account amounts are hidden in the images. The interface is in Bulgarian.
- Datacandles for 18 assets
- Signalevery 30 minutes
- Bookentry, stop, target, fees
- AlertTelegram with a chart
- Dashboardbrowser and phone
Lessons
What I learned
Fees kill the low timeframes
After fees the profit factor was 0.44 on 1 minute, 0.69 on 5 minutes and 0.92 on 1 hour. It only got above 1 on 4 hours. The shorter the trade, the bigger the share the fees take.
Chance is the most honest opponent
A pretty chart proves nothing. A comparison with random entries using the same stop shows whether there is a real edge, or whether the market simply went that way.
Proof first, money later
The strategy is still being tested virtually. The purpose of the system is to say honestly whether it works before any real money is at risk.
Beyond finance
Monitoring that never sleeps
The same system can watch any data: stock levels, competitor prices, orders, sensors. Automatic reports and web dashboards that run around the clock and send a message when something happens.
The strategy itself stays private. An educational project, not investment advice.